Log viewing
As it can be hard to make sense of logs, it can be useful to use dedicated log-viewing tools.
LNAV
LNAV, short for Log Navigator, is an efficient log viewing CLI which gives you a very handy set of tools. Some are reviewed here, which are a good starting point, check out more features and the full docs here
Piping
Being a CLI allows to pipe things to it, as logs from the I/O service
curl -u designer:$IO_PASSWORD --form service=logs $IO_URL | lnav
It also makes it possible to follow a stream of logs from a docker containers in a remote server through SSH:
ssh -n user@server "docker exec -i containername tail -n +0 -F /usr/local/tomcat/webapps/ROOT/WEB-INF/log/simplicite.log" | lnav
Log files merging
By calling lnav on multiple files, it will chronologically merge them, which can be very usefull to analyze a a long period of time split over different files, or the output of different parts of the stack in the same view (for example merging simplicité logs + tomcat logs + proxy logs).
lnav simplicite.log tomcat.log proxy.log
Filtering
Press tab to open the filtering panel, and enter a regex to filter or filter out logs. Filtering the following logs (Cron and Garbage collector)
can greatly improve overall readability. You can easily deactivate a filter with the spacebar in the filtering panel (Tab).
CronManager|ICORECM004|ICORECM005|MEMGC|ProcessScheduler
You could also install this trigger to automatically set the filter when the
Searching
Use / to search using a regex, or use chronological navigation
to fastly navigate to the next hour for example.
Timeline view
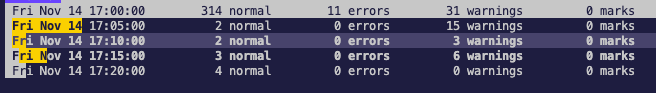
Press i to get a histogram view of the repartition of the error levels over time:
Simplicité logs parser
To best analyze lines, lnav uses a PCRE parser that can be customized. You can install the following JSON file with lnav -i lnav-simplicite-format.json.
{
    "$schema":"https://lnav.org/schemas/format-v1.schema.json",
    "simplicite":{
        "title":"Simplicité",
        "description":"Simplicité Low-Code Platform log format",
        "regex":{
            "main":{
                "pattern":"^(?<timestamp>.*?)\\|(?<app>SIMPLICITE)\\|(?<level>.+?)\\|\\|(?<endpoint>.*?)\\|(?<contextPath>.*?)\\|(?<event>.*?)\\|(?<user>.*?)\\|(?<class>.*?)\\|(?<function>.*?)\\|(?<rowId>.*?)\\|(?<body>.*)$"
            },
            "init":{
                "pattern":"^(?<timestamp>[^\\|]*?)\\|(?<app>SIMPLICITE)\\|(?<level>[^\\|]+?)\\|(?<body>[^\\|]*)$"
            }
        },
        "value":{
            "timestamp":{ "kind":"string" },
            "app":{ "kind":"string", "hidden":true },
            "level":{ "kind":"string" },
            "contextPath":{ "kind":"string", "hidden":true },
            "endpoint":{ "kind":"string", "hidden":true },
            "event":{ "kind":"string", "hidden":true },
            "user":{ "kind":"string", "hidden":true },
            "class":{ "kind":"string", "hidden":true },
            "function":{ "kind":"string", "hidden":true },
            "rowId":{ "kind":"string", "hidden":true }
        },
        "sample":[
            {
                "line":"2025-11-19 00:00:00,227|SIMPLICITE|INFO||http://46d6af5a5f20:8080||ICORECM005|system|com.simplicite.util.CronJob|run||Result of job deadlineActivity :"
            }
        ]
    }
}
Having this configured helps lnav know what each part of the log line corresponds to, so you can focus on a line and press p to get a detailed view:
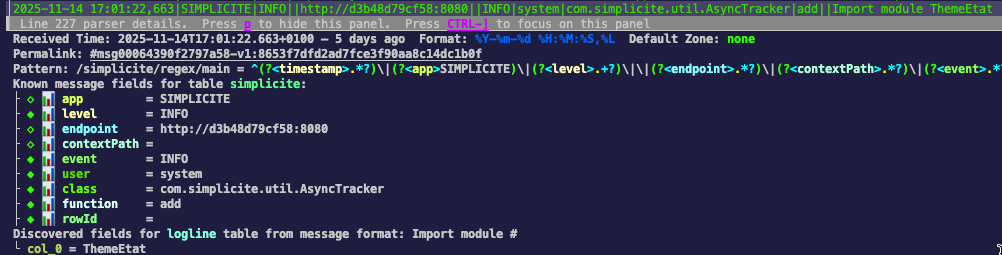
It also allow to do some redundant field hiding to get a more compact view by default. Hidden fields appear with yellow dots,
and they are shown by pressing x:

Last and not least, having a defined format simplifies the installation of a trigger that adds the "filter-out" rule mentioned earlier.
Use the following command lnav -i add_simplicite_filters.sql
CREATE TRIGGER IF NOT EXISTS add_simplicite_filters
  AFTER INSERT ON lnav_events WHEN
    -- Check the event type
    jget(NEW.content, '/$schema') =
      'https://lnav.org/event-file-format-detected-v1.schema.json' AND
    -- Only create the filter when a given format is seen
    jget(NEW.content, '/format') = 'simplicite' AND
    -- Don't create the filter if it's already there
    NOT EXISTS (
      SELECT 1 FROM lnav_view_filters WHERE pattern = 'CronManager|ICORECM004|ICORECM005|MEMGC|ProcessScheduler')
BEGIN
INSERT INTO lnav_view_filters (view_name, enabled, type, pattern) VALUES
    ('log', 1, 'OUT', 'CronManager|ICORECM004|ICORECM005|MEMGC|ProcessScheduler');
END;